Efficient data monitoring with Seeq
Rising water temperatures and falling water levels are a challenge for flora and fauna, but also for local industrial plants. For one of our customers, if the Rhine becomes too warm, no Rhine water may be used for cooling. This stipulation requires close monitoring. But how can this monitoring be implemented efficiently and reliably?

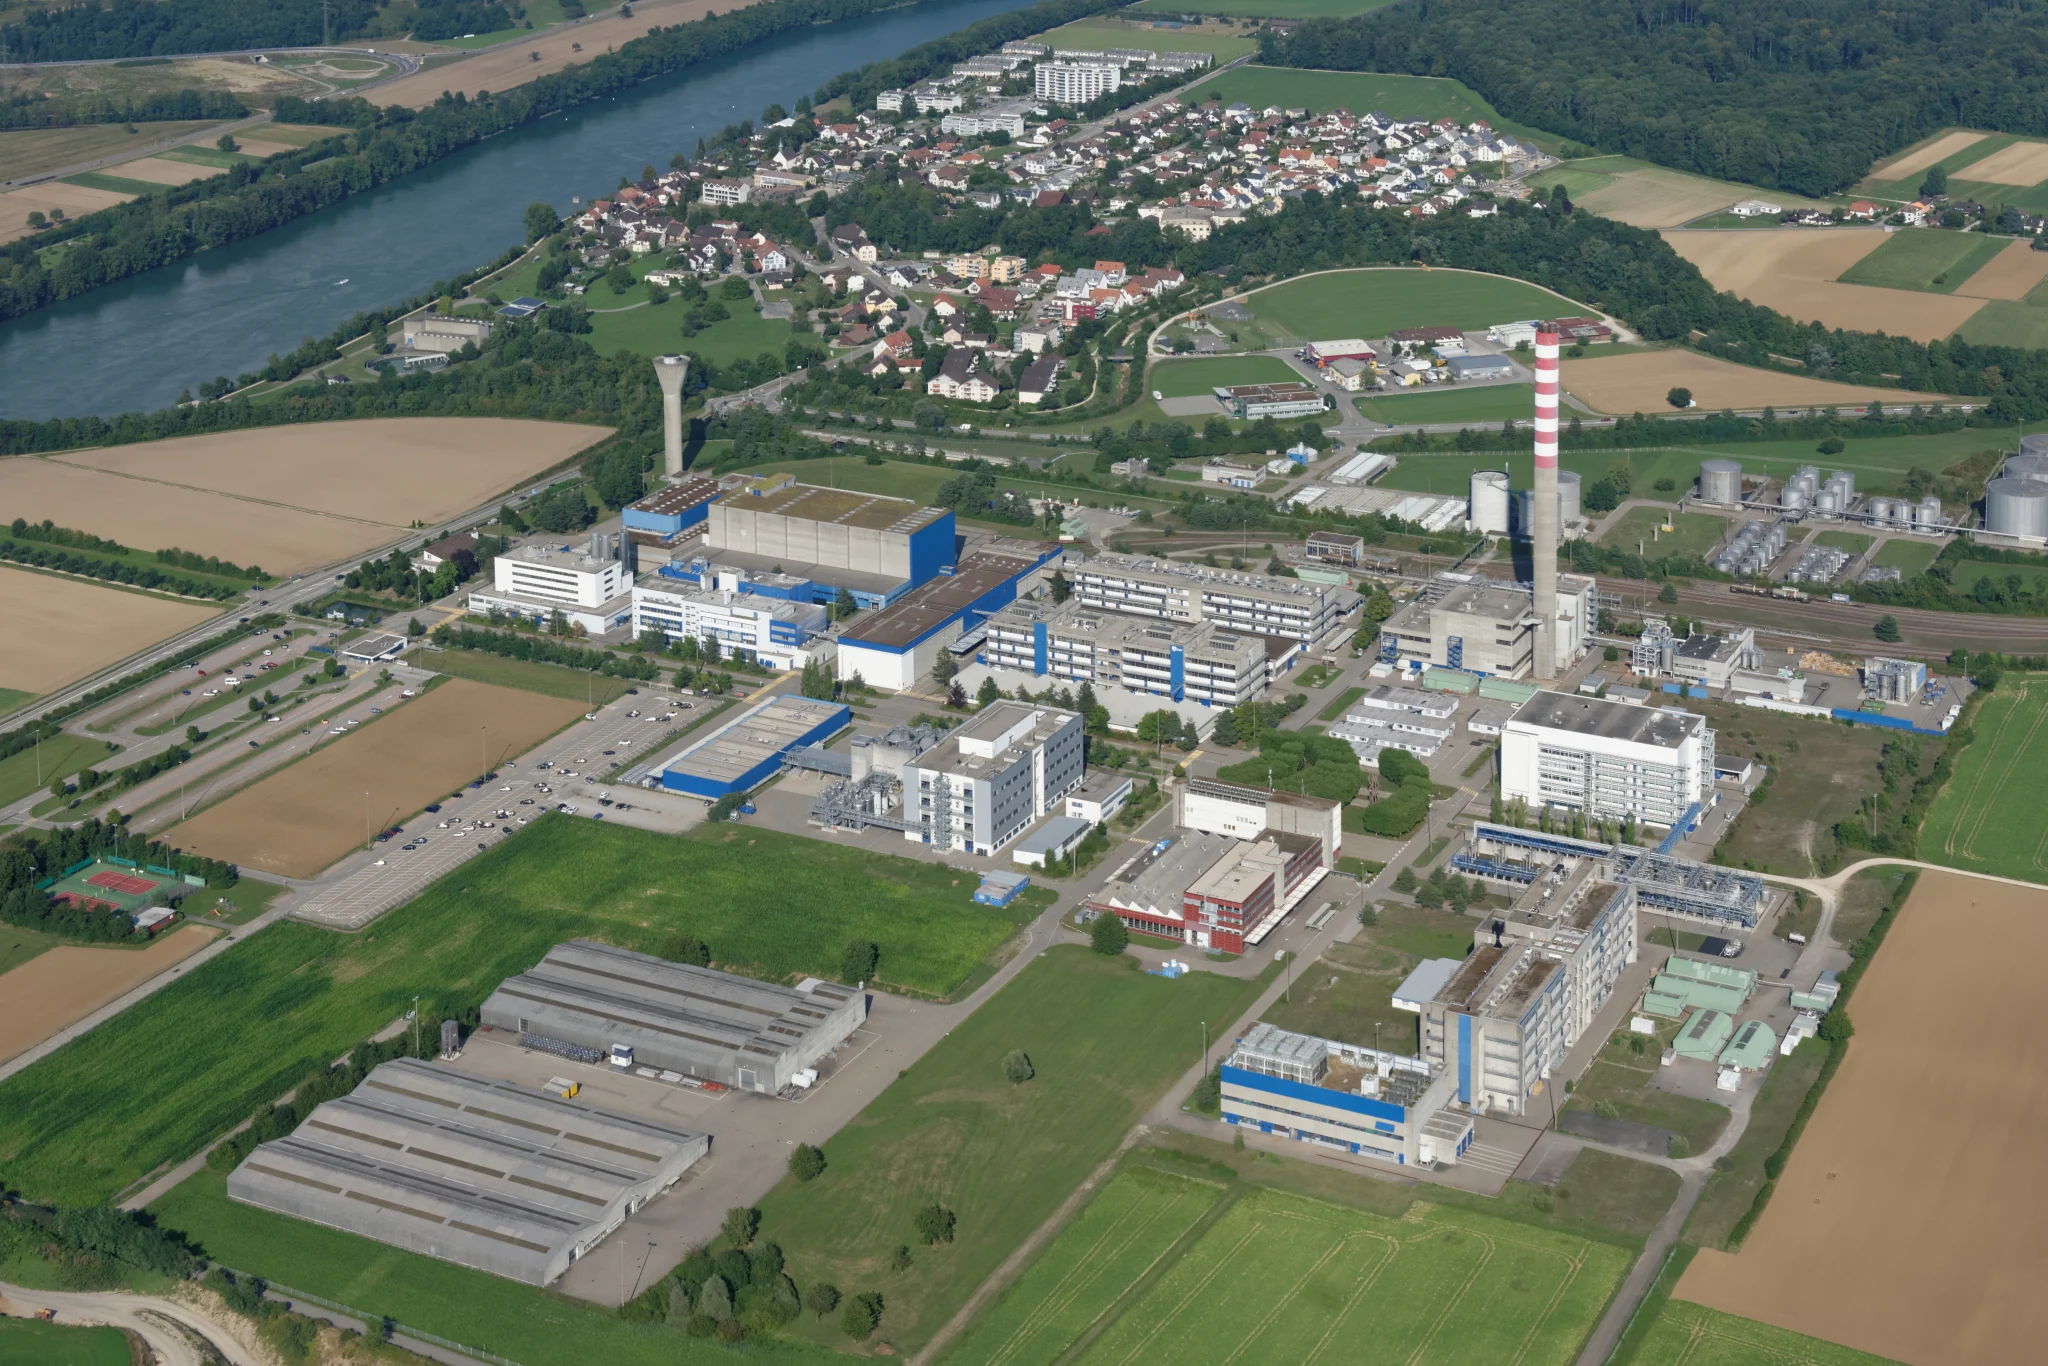
As a production site for vitamins, active pharmaceutical ingredients and ingredients for the food, animal feed and cosmetics industries, the DSM plant in Sisseln is subject to strict cantonal regulations. Among other things, the plant must monitor the temperature of the Rhine water. If the temperature is too high, the Rhine water may no longer be used for continuous cooling. This ensures that the Rhine is not additionally polluted by industry at high temperatures.
The company therefore wanted to establish a system that continuously monitors the temperature and flow rate of the Rhine and the cooling water. Software should automatically process and compare the data. The results are visualized live and clearly on a web-based dashboard. If a critical temperature is exceeded, automated messages are sent by e-mail.
Challenge: Data integration across different systems
Integrating the data via various interfaces proved to be a challenge. Although the Sisseln site already had a functioning data infrastructure on the Operational Data Layer (PI System), we were faced with a complex task: the Rhine water temperatures had to be retrieved via the web API of the Linked Data Services LINDAS (Swiss Federal Archives SFA) so that they could be compared and calculated with the cooling water data from the PI System.
As a Seeq system that uses data from the PI system is already in use, seamless integration was an obvious choice. The LINDAS Web API can be read out in Seeq DataLab without any problems, so thatthe entire monitoring could beimplemented in Seeq .
As a central analysis and monitoring platform, Seeq Industrial Analytics & AI offers a powerful platform for processing and visualizing time series data and is frequently used in the chemical, pharmaceutical and food industries as well as in energy and utility companies. However, companies are often faced with the complex task of using the software optimally and adapting it to their specific requirements.


