Skip to content

How the process for data science projects works

The Data Science Framework (DSF) from ControlTech Engineering AG supports companies in analyzing their data. In the standardized three-step process, everything revolves around the right target definition, data screening and data assessment. This navigation system will help you achieve your goals.

The topic of data science is on everyone's lips. ControlTech Engineering AG (CTE) from Liestal is also positioning itself in this area. Stefan Kramberg gave an update on our work at the Pharma Forum on April 25, 2024. The specialist presentation on the topic of the data science framework already addressed the topic of collecting and analyzing data last year. However, the importance of contextualization was demonstrated by this year's continuation: "We had the theoretical model, but not enough data. The data quality was also inadequate. That was a source of frustration. We really wanted to show practical results this year," explains data specialist and project manager Stefan Kramberg.

The Data Science Framework is a standardized process for data science projects with three steps, which are repeated iteratively (round after round).

The Data Science Framework is a standardized process for data science projects with three steps, which are repeated iteratively (round after round).

Then, at the beginning of the year, came the good news: "We've done it! The data analysis is helping us to optimize the manufacturing process," said Stefan Kramberg happily. The pilot project at the Institute of Chemistry and Bioanalytics at the FHNW in Muttenz focused on a production plant that did not produce for the market. However, it is in no way inferior to a production plant in terms of size or system architecture. It could therefore be used flexibly for our test. The PCS neo control system from Siemens was used as the basis, and the data was collected and structured using the AVEVA PI system.

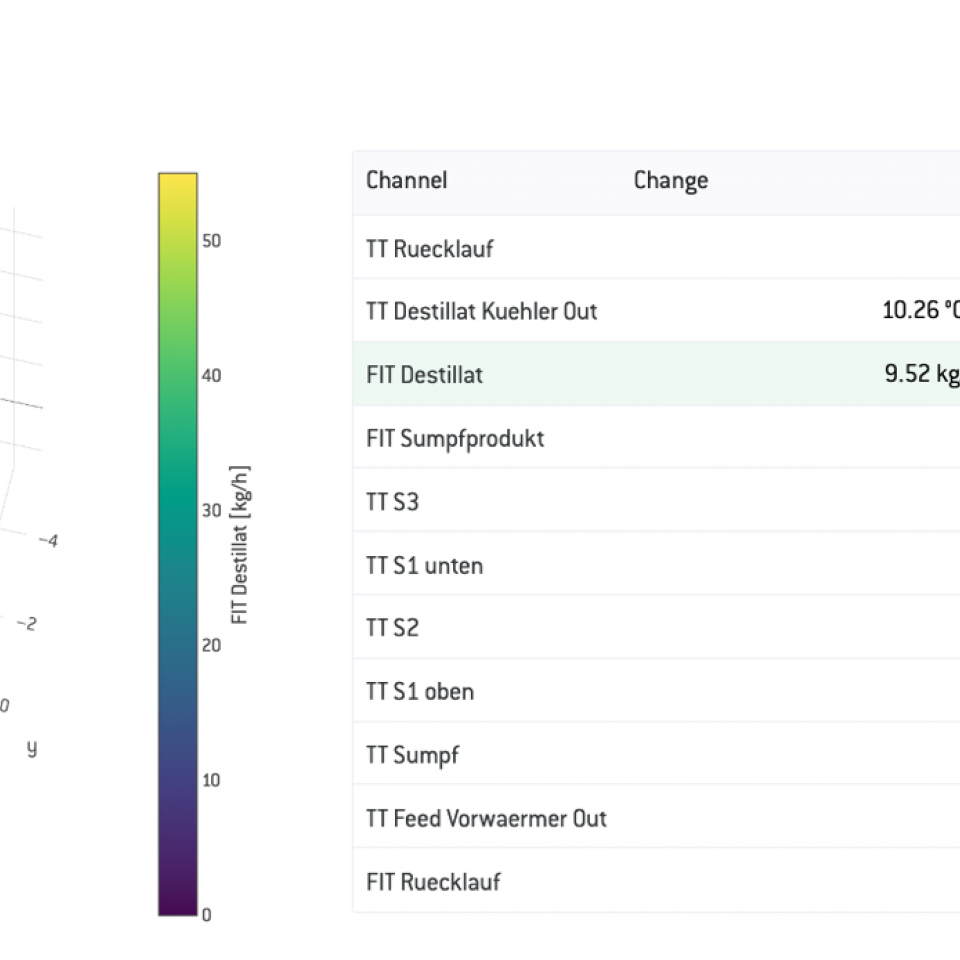
The objective was clear: the ethanol-water mixture was to be separated into ethanol and water, with ethanol being the product and water the waste product. The brief for the pilot project for the FHNW was for ControlTech Engineering (CTE) to achieve a cost reduction by reducing consumption of steam, coolant and nitrogen. The aim was also to increase quality. To this end, product purity was measured via the density of the distillate.

How the data science framework works in the use case:

  1. Target definition: Separate ethanol and water

  2. Data Screening: Process data for contextualization implemented in AVEVA PI AF

  3. Assessment: too few batches / data, further batches available from Q3 2023

After the first run, it became clear that the data science framework brings considerable added value, but contextualization is of great importance. This is the only way to detect inconsistent data and bring the data quality to a level that allows it to be used efficiently. The human factor is therefore indispensable!

Well-coordinated collaboration brings the desired success. The customer is at the center, while the system supplier, integrator and data analytics experts work closely together.

The visualization above shows that well-coordinated collaboration brings the desired success. The customer is at the center, while the system supplier, integrator and data analytics experts work closely together.

Combining the knowledge of all experts

The step from pure data to data networked with process knowledge was difficult. Collaboration with and the specialist knowledge of all experts was of central importance. From the data engineer to the automation and process engineer, the data scientist to the customer's business and system knowledge: Only when all knowledge is integrated into the data can the data analytics expert exploit the potential of data analysis through to AI.

Traditional communication barriers should also not be underestimated. Experts from different fields often speak different technical languages. Nevertheless, it is essential for the success of a data science project that they work closely together and understand each other precisely in detail.

For this reason, ControlTech Engineering opted for a partnership with Learning Machines. Stefan Kramberg explains: "We at CTE can collect and analyze data, but we need a partner who can bring order and structure to the complex data using statistical methods, machine and deep learning. In addition to the specialist knowledge of all those involved in the process, a competent partner is therefore needed to cleanse, process and, above all, structure and appropriately present the data. Only then can the data analysis be interpreted correctly."

The data analytics experts at Learning Machines developed a powerful AI dashboard that took into account plant and process knowledge, linked operational and process data and presented the data in a way that customers could understand. The AI dashboard was developed with the aim of enabling the respective experts to quickly and efficiently assess the data against customer objectives such as cost reduction and quality improvement. Artificial intelligence, i.e. more precisely CPA, machine learning and deep learning methods, helped to combine the knowledge of all those involved.

An interactive dashboard was used to explore data from production. Various AI modules automated the evaluation.

An interactive dashboard was used to explore data from production. Various AI modules automated the evaluation.

What is the AI dashboard?

The AI dashboard is an interactive dashboard for exploring data from production. The AI dashboard can use modern AI methods such as statistical learning (CPA method), machine learning and deep learning to structure, display and interpret the vast amounts of data from the many measurement series and channels. For example, it can recognize anomalies in the process, provide root cause analyses and calculate an ideal target-value correlation. Based on the input from the experts, it can even determine what the combination of measured values must be for a golden batch determination. In our practical example, the results from the AI dashboard were checked in the third step of the DSF and compared with the key requirements. Measures were then derived from the findings in order to achieve the defined goals.

Data Science Framework for the pharmaceutical industry provides great added value in the area of big data.

Live Demo

Take a look at the AI dashboard and easily analyze the data yourself!

Get access to the AI dashboard

Thanks to the AI dashboard, two important insights were gained even from this simple rectification column:

First insight: Optimization potential also thanks to specialist knowledge

In addition to displaying the process data, the AI dashboard also specifically found unusual vibration behavior in the system. A highly oscillating valve controller was found and analyzed. How would it behave in terms of product quality and production efficiency?

Here it became apparent that the controller is currently having too great an impact on system availability.

The data provided a clear answer: the oscillating controller had no influence on product quality and production efficiency. However, with the help of the AI dashboard, the experts at CTE were able to determine the current load cycles of the valves across all batches run. This showed that the valve was clearly overloaded in relation to its specified service life (mean time between failure, MTBF) per production run. It is to be expected that the valve would have to be serviced frequently or would fail. This would result in system downtime. Of course, this was not so relevant in the pilot project. In an active production plant, this fact would be of decisive importance for the overall plant efficiency.

Conclusion: The controller shows no optimization potential based on the data alone. But combined with operational and business knowledge, costs can still be reduced and system efficiency increased. For this reason, cooperation with people - with the specialist knowledge of all experts - is indispensable.

Second insight: How quality can be improved

Thanks to the AI dashboard and the data science framework, it was possible to gain insights that can be used to increase the quality and thus indirectly the efficiency of production. The optimization function of the AI dashboard delivered clear results: Based on the data, it was possible to show that the initial temperature of the flow has an influence on product quality. The output temperature must not be below 51.06°C.

But is this temperature really the only factor that has such a strong influence on the quality of the product?

The graph above clearly shows that there are both good quality (batches 10 and 13) and poorer quality (batch 7) batches within a narrow range of the precursor temperature. It is therefore obvious that this temperature is not the only factor influencing the quality of the product, even if this is implied by the pure data.

New questions - new answers

To find these other factors, the AI dashboard offered the "3D quality hose". This visualized all measured values from the correctly completed processes with good results. The "3D quality hose" can therefore also be viewed as a three-dimensional representation of all measured values for a golden batch.

The golden batch as a hose explains the deviation of batch 7 in quality, despite the fact that the temperature of the preheater was very close to the optimum operating point:

The deviation from the optimum process sequence occurred primarily in the middle section of the column. In this area, the rectification column was too warm and left the ideal limits. The quality was therefore negatively affected primarily by an excessively high temperature in the middle of the column.

You can read about further advantages of the "3D quality hose" as a multiple golden batch and its added value in practice here.

Picture of Stefan Kramberg, IT Systems Engineer at ControlTech Engineering AG.

Do you also have complex tasks to solve? Then let us shed light on your production process together.

Book a non-binding consultation with Stefan Kramberg, OT Solutions Engineer.

Contact us now
More exciting insights into our everyday life:
Dominic Brunner, CEO of ControlTech Engineering AG, relies on big data.
New Data Management division

CTE, with over 30 years of experience in automation and industrial IT, is expanding its portfolio to include an important area: data management.

Picture by Noemi Wannenmacher Noemi Wannenmacher - 07.05.24
Data Science Framework for the pharmaceutical industry provides great added value in the area of big data.
Pharma Forum 2024: Data Science Framework

At Pharma Forum, we will present results and learnings from the Data Science Framework project at the FHNW Institute of Chemistry and Bioanalytics.

04.03.24
Underwater robot evoking the search for treasures at the bottom of the sea. Image generated with artificial intelligence (Midjourney)
Data Science Framework

Our navigation system for your successful data based optimisation!