Data Visualization
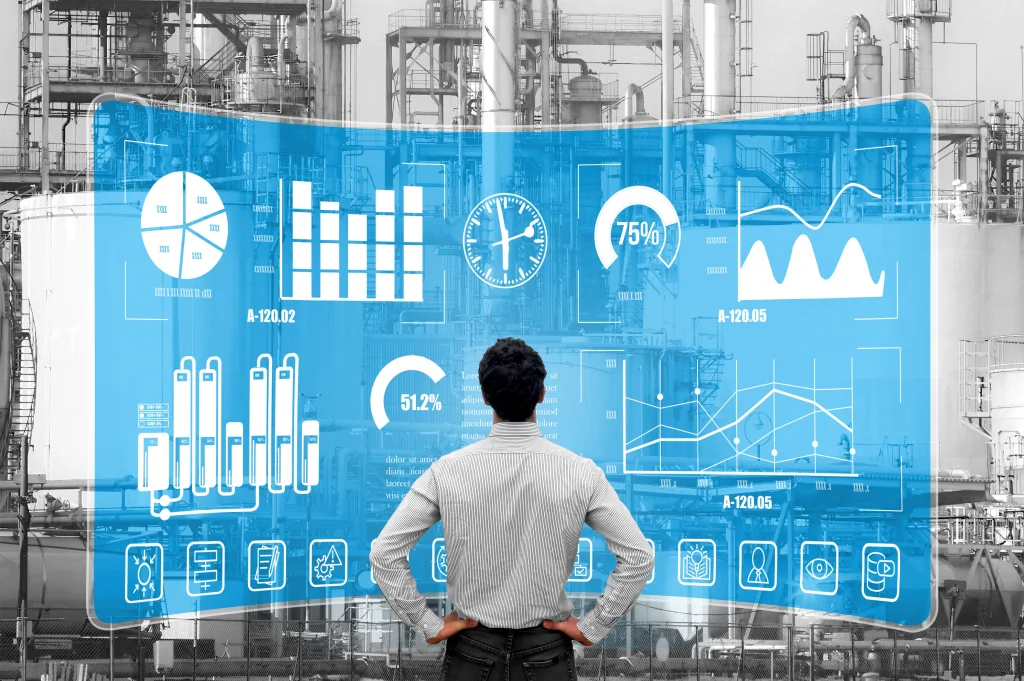
Benefit from important insights from your process data. We help you with easy-to-understand dashboards and tools.
Visualizing your process data gives you a clear overview and insight into your production. Your data can be displayed, analysed and contextualized in real time or historically. Clear diagrams, tables or individual graphic elements can thus be displayed. We create dashboards tailored to your needs, taking into account the KPIs you have defined in order to bring different data sources into relation. Thanks to remote access, you can always receive the latest data via a web interface or smartphone app.


